Test your knowledge of the ECG waves, segments and intervals with these questions.
A. It is normally between 120 and 150 ms in duration
B. It is positive in lead AVR
C. It represents atrial repolarisation
D. It is less than 2.5 mm in amplitude in the limb leads
E. It is negative in lead II
Show Answer
Answer: D. It is less than 2.5 mm in amplitude in the limb leads
The P wave is the first positive deflection on the ECG. It is a small smooth-contoured wave and represents atrial depolarisation. Atrial repolarisation is not visible as the amplitude is too small.
The normal P wave is:
- <120 ms in duration (3 ‘small squares’)
- <2.5 mm in amplitude in the limb leads
- <1.5 mm in amplitude in the chest leads
- Positive in lead II and negative in lead AVR
A. They can be a normal finding in lead V2
B. They can be a normal finding in lead III
C. They are pathological if greater than one third of the height of the subsequent R wave
D. They are pathological if greater than 0.02 seconds in duration
E. They are always an abnormal finding in lead V1
Show Answer
Answer: B. They can be a normal finding in lead III
Q waves can be a normal finding in leads III and aVR. They are pathological if they are greater than half the height of the subsequent R wave or if they are greater than 0.04 seconds in duration.
A. It commences at the start of the P wave
B. It ends at the end of the QRS complex
C. It represents the duration of the conduction of electrical impulses from the AV node to the bundle branches and Purkinje fibres
D. Deviation can occur under normal circumstances
E. It is the interval between ventricular depolarization and repolarisation
Show Answer
Answer: C. It represents the duration of the conduction of electrical impulses from the AV node to the bundle branches and Purkinje fibres
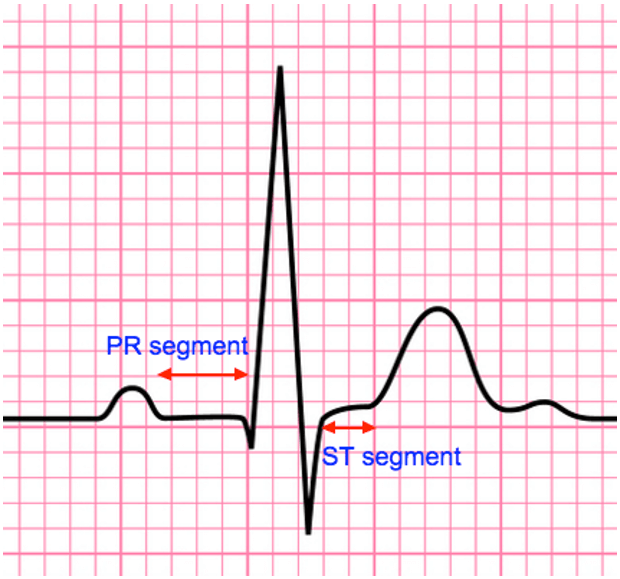
The PR segment commences at the endpoint of the P wave and ends at the start of the QRS complex. It represents the duration of the conduction of electrical impulses from the AV node to the bundle branches and Purkinje fibres. The PR segment is isoelectric under normal circumstances, but deviation can occur in the presence of pericarditis and atrial ischaemia.

The ECG segments © Medical Exam Prep
A. It commences at the J point
B. It is isoelectric under normal circumstances
C. It ends at the end of the T wave
D. The ventricles are contracted during the ST segment
E. The atria are relaxed during the ST segment
Show Answer
Answer: E. It ends at the end of the T wave
The ST segment commences at the end of the S wave (the J point) and ends at the beginning of the T wave. The ST segment is isoelectric under normal circumstances as the atria are relaxed and the ventricles contracted, and there is, therefore, no visible electrical activity.
The most important causes of ST segment deviation are myocardial ischaemia and infarction, with ischaemia causing ST depression and infarction causing ST elevation.
A. The P wave is 0.08-0.10 seconds in duration
B. The QRS complex is 0.12-0.20 seconds in duration
C. The corrected QT interval is normally less than 0.35 seconds
D. The corrected QT interval can be calculated by the square root of the RR interval divided by the QT interval
E. The PR segment is measured from the start of the P wave to the start of the QRS complex
Show Answer
Answer: A. The P wave is 0.08-0.10 seconds in duration
The P wave is 0.08-0.10 seconds in duration. The QRS complex is 0.06 – 0.10 seconds in duration.
The PR interval is measured from the start of the P wave to the start of the QRS complex. The PR segment represents the period of time from the end of the P wave to the start of the QRS complex.
The ST segment is measured from the end of the QRS complex to the start of the T wave. It is the interval between ventricular depolarisation and repolarisation.
The ST interval is measured from the end of the QRS complex to the end of the T wave.
The QT interval is measured from the start of the QRS complex to the end of the T wave. The corrected QT interval is normally less than 0.44 seconds. The corrected QT interval can be calculated by the QT interval divided by the square root of the RR interval.
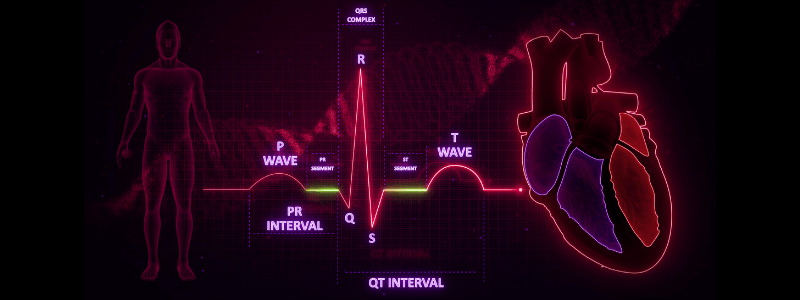
Header image used on licence from Shutterstock
Learn more about the ECG with our FREE ECG eBook ‘The Beginner’s Guide to the ECG’


